Anomaly Detection at SURP

Anomaly Detection at SURP
Anomaly Detection at SURP
Even during the summer, Rowan’s students in the Computer Science Department are hard at work. Nowhere is that clearer than with the SURP Program. Through the SURP Program, students have conducted research on various topics over the course of several weeks during the summer. On July 21, students had the opportunity to demonstrate the culmination of their work at the Poster Session. It was at this Poster Session that some of the brilliant minds at Rowan got to show off their research and discuss it with visitors. This article will provide a spotlight on some of the Computer Science projects that were present at this event.
The research topic that will be covered today is anomaly detection. This topic is unique in that there were actually two different posters about it. At the Poster Session, Owen Anderson and Nirav Patel both shared some info about their individual takes on this research topic. Now, some of you may be wondering, what is anomaly detection? How does it work? How can we apply it to everyday life? Well, these are just a few of the questions that this article aims to answer.
Let’s start with the basics. An anomaly is essentially any data point that stands out as unusual. The implications of this unusual data point are different depending on what you’re measuring. For example, if you’re measuring data from your computer’s firewall, an anomaly might indicate a breach in that firewall. Obviously, it’s important to know when something like that happens so that the problem can be addressed as soon as possible. This is what the research conducted by Owen and Nirav seeks to accomplish, as they developed and tested a system that can help detect these anomalies.
| For the purposes of examining the data, it was organized into a graph. The data can also be represented in a matrix, which Owen noted is actually easier to work with in some aspects, but the focus in this article will remain on the graph. The graph pictured here comes from Nirav Patel’s poster. Each point on the X-axis of the graph represents a specific point in time. The Y-axis represents a variable called the martingale value. To put it simply, the martingale value is meant to help discern whether or not there’s an anomaly in the data. If the value is really high, then there’s probably an anomaly. | 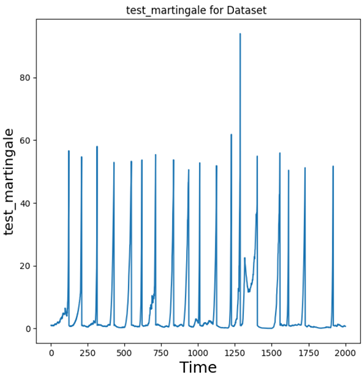 |
Now, it’s obviously not enough to just make the system and the graph and then call it a day. You need to test these things to make sure they work properly. As Nirav explained, the way he tested his system was by creating anomalies on purpose at regular intervals to see if the system would detect them. For this test, he simulated an anomaly on every 100th timestep. This means that if the system works properly, every 100th point on the X-axis should show a massive spike in the Y-axis value. Looking at his example from the poster, that’s exactly what happened. Ergo, the test was a success. The system works as intended.
So, what is the practical application for a system like this? Well, there’s actually quite a few places this research could be applied. There’s the aforementioned application of cybersecurity. That is actually the application that Nirav finds the most important. Being able to get fast, accurate data about potential breaches in a digital security system is very important in our modern, computer-reliant society. Beyond that, however, there’s other uses, such as market analysis and fraud detection. There was also one rather unexpected application that Owen brought up: tracking the spread of wildfires.
Truly, even just one research topic can have many different real-world applications. And these anomaly detection projects are only the tip of the iceberg. Be sure to check in soon for more articles about some of the ideas and systems that were shown off at the Poster Session by the students here in Rowan’s Computer Science Department.
Written by Cole Goetz | Posted 2021.09.15